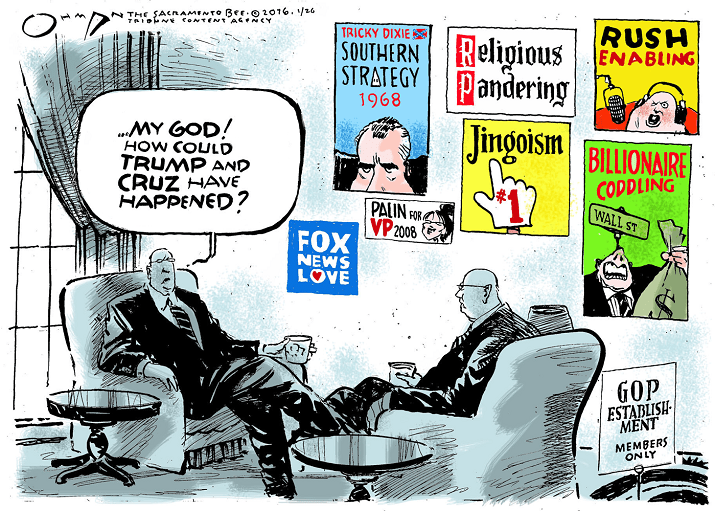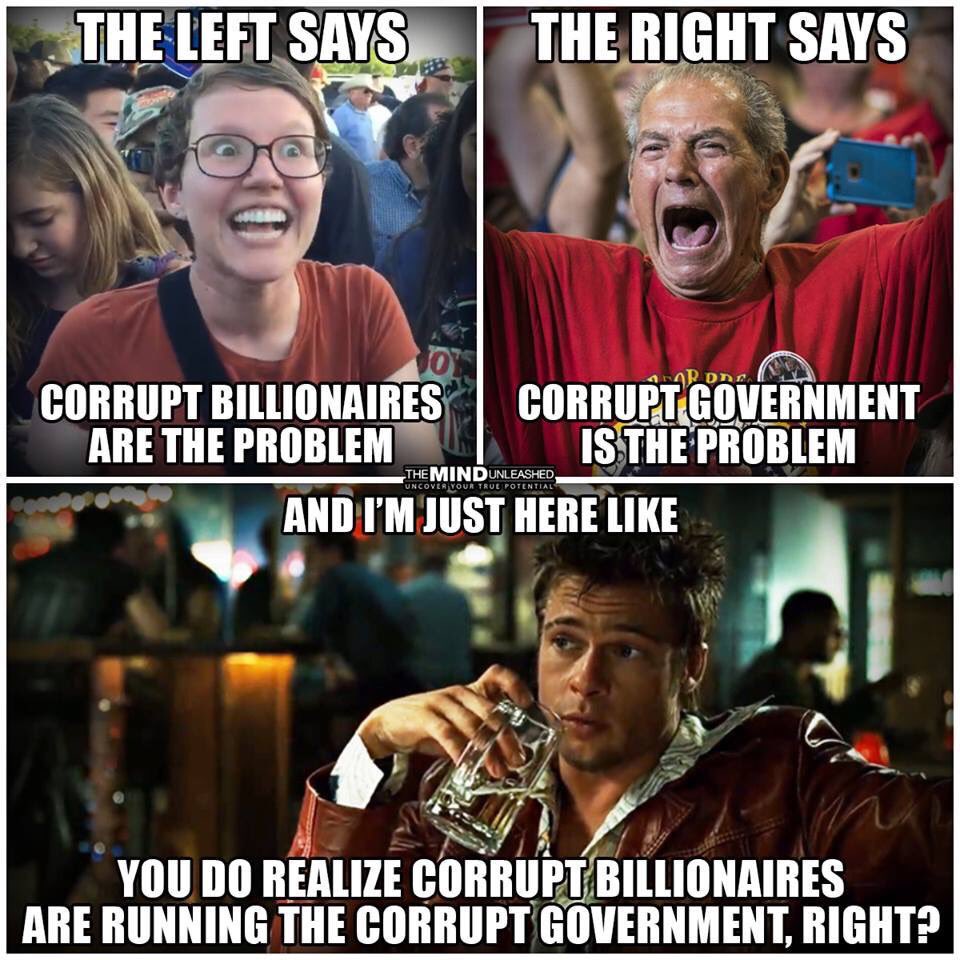
Anyone who follows this post knows the following mantra. As per the Economic Policy Institute (EPI), from WWII to 1973, when US corporations productivity numbers increased to 95.65%, the average workers’ pay wages increased to 91%. This paradigm shifted after 1973-2018, as corporate productivity increased by 77%, but the average workers’ pay increased by less than 13%.
My theory is that the average American Joe worker’s lot changed in 1973 with the start of ALEC (American Legislative Exchange Council ), which is a non profit organization set up to advance corporate and other conservative interests.
That economic inequality characterizes the American economy is not a shock to average working Americans. Study after study demonstrates that the USA has more wealth concentration than most other developed nations.

Meanwhile those GOP mega ‘Dark Money’ donors, who have been blessed with an abundance of riches since the 2008 Great Recession while most of us have lost ground to where we’re still recovering, had been pushing for US lawmakers to end ACA Obamacare in 2017 to pay for their 2017 GOP tax cuts bill. This donor class is very motivated to secure/ protect their wealth to where they can be counted with the other factions that comprise President Donald Trump’s base of voters, like the anti-immigration zealots; Evangelicals as the anti-climate change science, anti-abortion and anti-LGBTQ rights crowd; the racists which includes those who are the anti-Semitics and anti-Muslim: and the NRA second amendment enthusiasts.

Here is the rest of the story…
On February 8, 2019, Christopher Ingraham of the Washington Post penned the following report, “Wealth concentration returning to ‘levels last seen during the Roaring Twenties,’ according to new research”
Excerpts:
“The 400 richest Americans — the top 0.00025 percent of the population — have tripled their share of the nation’s wealth since the early 1980s, according to a new working paper on wealth inequality by University of California at Berkeley economist Gabriel Zucman.”
“Those 400 Americans own more of the country’s riches than the 150 million adults in the bottom 60 percent of the wealth distribution, who saw their share of the nation’s wealth fall from 5.7 percent in 1987 to 2.1 percent in 2014, according to the World Inequality Database maintained by Zucman and others.”

“Overall, Zucman finds that “U.S. wealth concentration seems to have returned to levels last seen during the Roaring Twenties.” That shift is eroding security from families in the lower and middle classes, who rely on their small stores of wealth to finance their retirement and to smooth over economic shocks like the loss of a job. And it’s consolidating power in the hands of the nation’s billionaires, who are increasingly using their riches to purchase political influence.”
“Zucman, who advised Sen. Elizabeth Warren (D-Mass.) on a recent proposal to tax high levels of wealth, warns that these numbers may understate the amount of wealth concentrated in the hands of the rich: It has become more difficult to account for the true wealth of the ultra-rich in recent decades, in part because many hide their assets in offshore tax shelters.”
“Wealth, here, is roughly synonymous with net worth: the value of everything that a family owns, minus the value of any debt. Assets such as homes, land, rental properties, stock holdings, business equity and bank accounts are included.”
“The definition excludes personal possessions like cars and furniture. They’re difficult to measure, don’t produce income and would amount to a tiny fraction of the nation’s net worth if they were included, according to Zucman.”

“American wealth is highly unevenly distributed, much more so than income. According to Zucman’s latest calculations, today the top 0.1 percent of the population has captured nearly 20 percent of the nation’s wealth, giving them a greater slice of the American pie than the bottom 80 percent of the population combined. That bottom 80 percent figure includes the 1 in 5 American households that has either zero or negative wealth, meaning that its debts are greater than or equal to its assets. According to NYU’s Wolff, the share of U.S. households with zero or negative wealth has risen by roughly one-third since 1983, when it was 15.5 percent.”
“The top 10 percent of individuals, meanwhile, own more than 70 percent of the nation’s wealth, more than twice the amount owned by the bottom 90 percent. The top 10 percent have increased their share of wealth by about 10 percentage points since the early 1980s, with a concomitant decline in the share of wealth owned by everyone else. In some ways, Zucman finds, the distribution of wealth in the US more closely resembles the situation in Russia and China than in other advanced democracies such as the UK and France.”

“Several caveats to this discussion are in order. First, a person with negative net worth is not necessarily penniless. A number of the households in the negative-net-worth bucket may be young professionals, like doctors or lawyers, starting off their careers with large amounts of student debt. This is not necessarily a problem if their high earnings ultimately erase their debt and catapult them into the upper reaches of the wealth spectrum later in their careers.”
“But young, high-earning professionals account for a minority of negative-net-worth families. The 2016 Survey of Consumer Finances, for instance, shows that about 40 percent of families in the bottom quartile of net worth had an outstanding student loan balance of any kind.”
“Second, rising wealth inequality may not necessarily be a zero-sum game: The rich gobbling up a larger share of the national wealth pie may not be a problem if there’s still more pie left for everyone else, relative to several years or decades ago. There’s good reason to suspect that this may be the case for income: While incomes at the top have risen dramatically over the past few decades, incomes in the middle have risen, too, albeit much more slowly.”
“But the same dynamic is not occurring with household wealth. According to Wolff, the median household wealth in the United States in 2016 ($78,100) was slightly lower, in inflation-adjusted dollars, than it was three decades ago in 1983 ($80,000). Over the same time period, the average wealth of the top 1 percent of households more than doubled, from $10.6 million to $26.4 million.”

“The wealthy are becoming wealthier, in other words, and there’s good reason to think it’s happening at the expense of everyone else. As Zucman notes, this has very different implications for different groups of people. “For everybody except the rich,” he writes, wealth’s “main function is to provide security.” Middle-class families tend to use their wealth to save for rainy-day expenses or to draw down on for retirement.”
But “for the rich, wealth begets power,” according to Zucman. Our electoral system is highly dependent on outside financing, creating numerous opportunities for the wealthy to convert their money into influence and tip the political scales in their favor. As a result, politicians have become accustomed to playing close attention to the interests of the wealthy and passing policies that reflect them, even in cases where public opinion is strongly trending in the opposite direction.”

“Wealth concentration may help explain the lack of redistributive responses to the rise of inequality observed since the 1980s,” Zucman writes. The interplay between money and power, in other words, may be self-reinforcing: The wealthy use their money to buy political power, and they use some of that power to protect their money.”
Gronda, this widening has been occurring for going on fifty years, tracing back to Reagan tax cuts and an extensive offshoring and outsourcing movement. It was made worse with the greater use of equity as incentives and technology gains, The tax cuts of 13 months ago have made it even worse.
People will look to anyone talking to them as someone who might help. They were greatly fooled by a salesman named Trump. We must address this widening gap or those voices will get louder. Keith
LikeLiked by 1 person
Dear Keith,
You reflect my concern. I don’t want to see the US devolve into what France is experiencing with all their yellow vest protests.
Peoples can be squeezed too far where they react in less than constructive ways. The problem with the GOP with rare exception is that they don’t like to present solutions, like fixing ACA, or addressing the issues of income inequality or climate change. Then they criticize the democrats as they present their policies/ solutions.
Hugs, Gronda
LikeLike