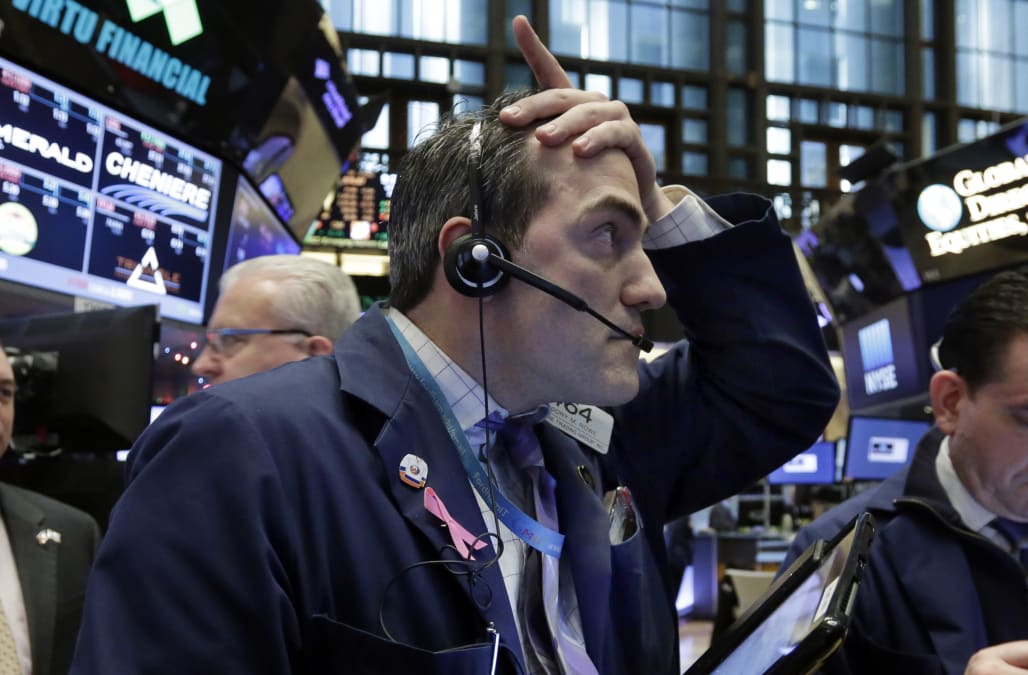
This is a big deal. This is the first time (December 2018) that the U.S. Treasury yield curve has inverted in 10 years. In the past, every time the yield curve (as measured by the difference between one and ten-year Treasury yields) turned down between 1955 and 2018, a recession happened within two years.
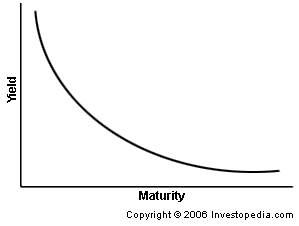 As per Investopedia: “An inverted yield curve is an interest rate environment in which long-term debt instruments have a lower yield than short-term debt instruments of the same credit quality. This type of yield curve is the rarest of the three main curve types and is considered to be a predictor of economic recession.”
That puts the timing for the next recession in 2020. This is just when the republicans would be hoping to win elections, in part, because of a booming economy.
Click here for a QuickTake on the yield curve
As per the April 12, 2018 MoneyWeek report, “An inverted yield curve is what you get when the yield curve slopes downwards. In other words, investors are asking for more interest on short-term loans than on long-term ones.”
“That doesn’t happen often. It usually only happens when investors expect a recession and are therefore clamouring for the perceived safety of US government bonds.”
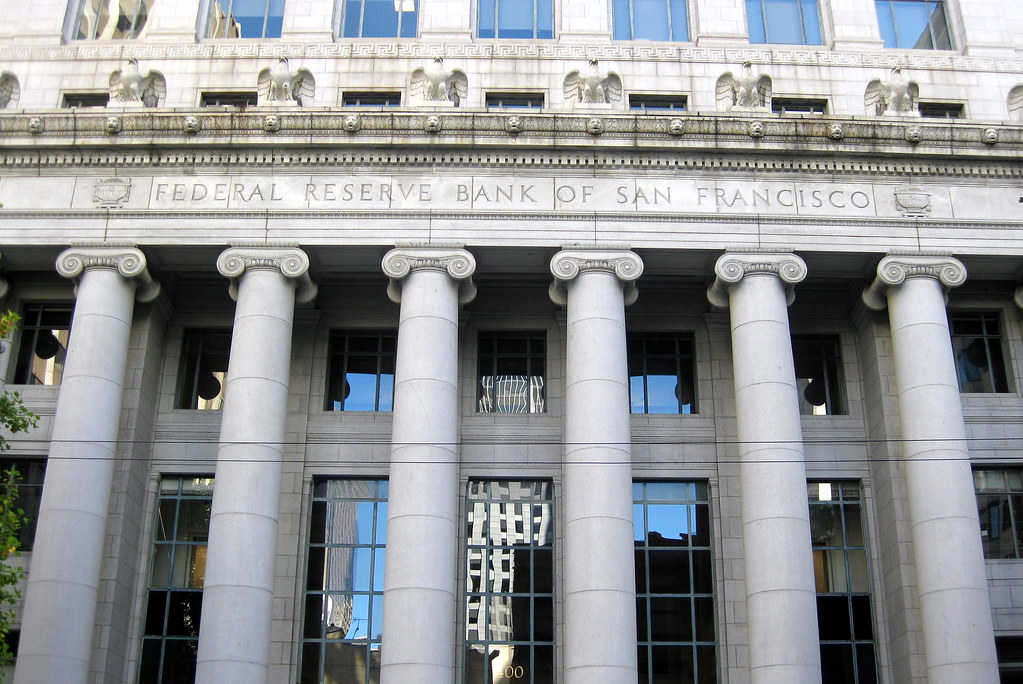
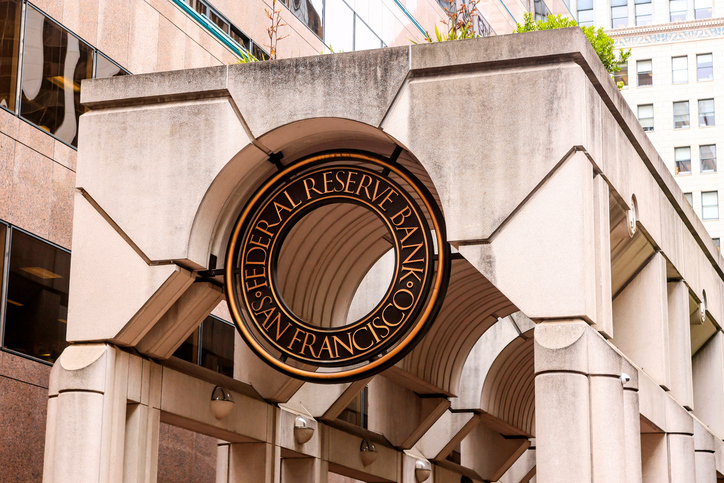
“In fact, “every US recession in the past 60 years was preceded by… an inverted yield curve,” note Michael D Bauer and Thomas M Mertens of the Federal Reserve Bank of San Francisco in a paper on the topic.”

“Now, that doesn’t necessarily mean anything. After all, a stopped clock is right twice a day. So to get any value from the inverted yield curve, you also have to ask – how many false positives did it generate?”
The answer to that is impressive – only one. And on that occasion, the economy did slow down, in any case.
To be more specific, every time the yield curve (as measured by the difference between one and ten-year Treasury yields – other people more commonly look at the gap between two and ten-year) turned down between 1955 and 2018, a recession happened within two years.
The single false alarm happened in the mid-1960s “when an inversion was followed by an economic slowdown but not an official recession.”
Here is the rest of the story…
On December 3, 2018, Brian Chappatta of Bloomberg penned the following opinion piece,”The U.S. Yield Curve Just Inverted. That’s Huge.” (“The move ushers in fresh questions about the Fed and the economy.”)
Excerpts:
“The U.S. Treasury yield curve just inverted for the first time in more than a decade.”
“”It’s a moment that the world’s biggest bond market has been thinking about for the past 12 months. I wrote around this time last year that Wall Street had come down with a case of flattening fever, with six of the 11 analysts I surveyed saying that the curve from two to 10 years would invert at least briefly by the end of 2019. That’s not exactly what happened Monday, though that spread did reach the lowest since 2007. Rather, the difference between three- and five-year Treasury yields dropped below zero, marking the first portion of the curve to invert in this cycle.”

“The move didn’t come out of nowhere. In fact, I wrote a week ago that the spread between short-term Treasury notes was racing toward inversion, and Bloomberg News’s Katherine Greifeld and Emily Barrett noted the failed break below -0- on Friday. Still, I wasn’t necessarily expecting this day to come so soon. Rate strategists have long said that being close doesn’t cut it when talking about an inverted yield curve and the well-known economic implications that come with it, namely that the spread between short- and long-term Treasury yields has dropped below zero ahead of each of the past seven recessions.”
“It’s important to keep in mind the timeline between inversion and economic slowdowns — it’s not instantaneous. The yield curve from three to five years dipped below zero during the last cycle for the first time in August 2005, some 28 months before the recession began. That this is the first portion to flip isn’t too surprising, considering how much scrutiny bond traders place on the Federal Reserve’s outlook for rate increases. All it means is that the central bank will probably leave interest rates steady, or even cut a bit, in 2022 or 2023. I’d argue that’s not just possible, but probable, given that we’re already in one of the longest economic expansions in U.S. history.”

“The more interesting question might be why this part of the yield curve won the race to inversion, rather than the spread between seven- and 10-year Treasuries, which looked destined to fall below -0- earlier this year. One reason could be that the Fed’s balance-sheet reduction is putting more pressure on 10-year notes than shorter-dated maturities, which wasn’t the case during past periods of inversion. Indeed, policy makers have shown no signs of easing up on this stealth tightening.”
“On top of that, the Treasury Department is selling increasing amounts of debt, which disproportionately affects the longest-dated obligations because buyers have to consider the duration risk they’re absorbing. Remember the curve from five to 30 years, which fell below 20 basis points in July? That spread is about 46 basis points now, driven by stubbornly higher long-bond yields.”
Given the recent pivot from the most important Fed leaders — Jerome Powell, Richard Clarida and John Williams — this flirtation with inversion among two-, three- and five-year Treasury notes probably isn’t going away. The bond market is fast approaching the point where traders have to ask themselves whether a rate hike now increases the chance of a cut in a few years. Other questions include “what is neutral?” and “can the Fed engineer a soft landing?” To say nothing about whether the assumed relationship between the labor market and inflation expectations is still intact.
See: 795-Point-Dow-Plunge And The Inverted Yield Curve / Forbes
See: Recession coming your way? US yield curve inverts for the first time /Economic Times .
See: This signal is the closest you’ll get to a sure thing in economics/ MoneyWeek

Gronda, this inversion is telling. Quite simply, people think the economy is going to be worse long term than short term. We are on a sugar high due to the tax cut leveraging a pretty good and long running economy, but the tariffs, trade confusion and relationship battering coming out of this White House and capital investment has dramatically slowed.
It got worse today with the confusion on the China non-deal. But, you may want to check out what JP Morgan Chase told its investors earlier in the week after the dinner with China and Trunp’s statements. In essence, they said the President was fabricating or grossly exaggerating a deal. Keith
LikeLiked by 2 people
Dear Keith,
The recent (Dec. 2018) inverted yield curve for the 1st time in 10 yrs. portends a slowing economy as the best case scenario within the next two years.
This means that we can’t afford the president’s trade deal shenanigans. It’s time for the US Congress GOP lawmakers to step up to the plate to restrain the president. It was really telling that the president deliberately made up the story about the trade deal he made with China. This reminds me of the time that he wanted Mexico’s president to agree to pay for his wall just to help him out/ not embarrass him. Then there was his hyping of his deal with N Korea. He just makes things up.. We can’t operate a country like this.
Hugs, Gronda
LikeLiked by 2 people
Gronda, the Chinese and other country leaders are each having more than a few WTF moments with this mercurial man. He feels it is perfectly OK to lie about things, but the GOP leadership is now getting a little tired of it. Because more people can see most of what he is says is BS. Keith
LikeLiked by 1 person